This week’s intelligence breakdown: Candlesticks
Disclaimer: This is not financial advice. Always do your own research and consult a professional before making any financial decisions.
WEEK 32: AUG 04-08 ERT 10 MIN
Why My Natural Gas Trade is Either Genius… or a Disaster Waiting to Happen
Alright, fellow Trader —grab your popcorn (or your trading journals), because we’re diving into my latest adventure: a CFD Natural Gas Futures position(s) that’s either going to make me look like a trading wizard… or have me crying into my charts.
This week I’m breaking down my last three trades, no volume jargon or fancy levels, mostly just about candlesticks whispering. Whether you’re a newbie or a chart-weary veteran, these real-deal breakdowns might just save you from repeating my facepalms. Let’s get uncomfortably educational.
Anatomy of a Missed Opportunity
How Greed and Poor Planning Turned My Winning Natural Gas Trade Into a Stress Test

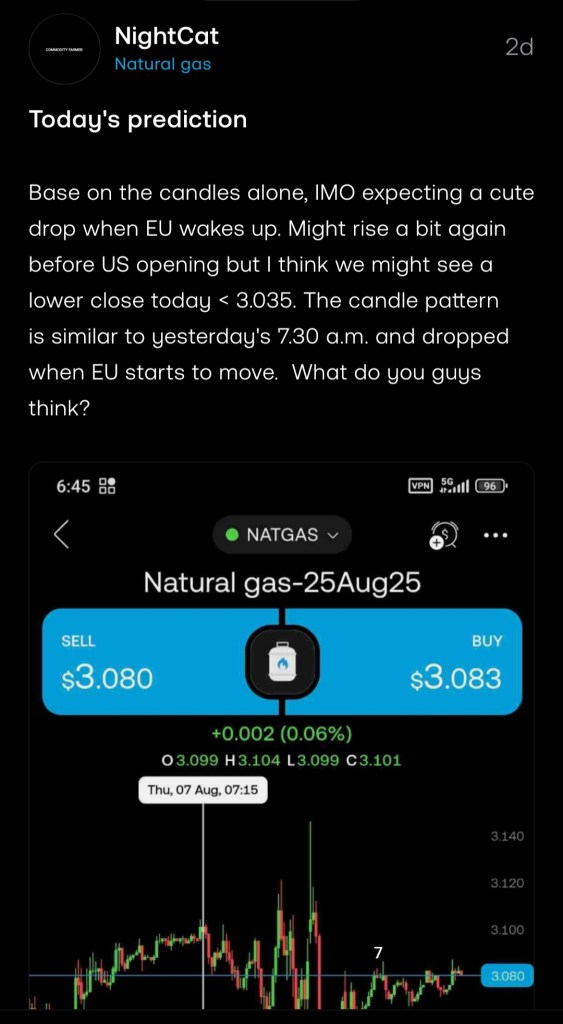
On August 6, I shorted Natural Gas at 3.082 after spotting what looked like a textbook reversal pattern. Even threw out a prediction on the trading forum that, to my surprise, turned out suspiciously accurate. The price dipped to 3.035 (at it lowest before the reverse) – a nice, tidy profit was right there for the taking. Although it wasn’t really a textbook reversal pattern, I’m too lazy to correct the AI generated part about this. But hey, stick around—this could get entertaining.
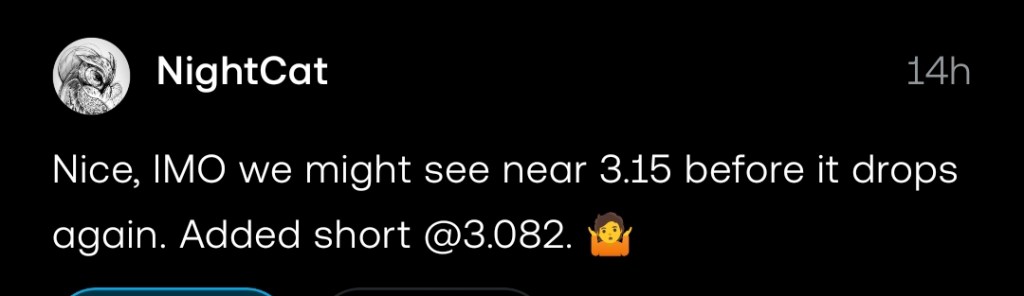
The prediction made on the forum before the price hits 3.146.
I entered the short long before the price went up to 3.146, the expectation was that the price would indeed rise but would fall again so I decided to keep my short open at the time. Just one hour after the U.S. open, as predicted: Natural Gas plummeted from 3.146 to 3.035—but only to sharply reverse course.
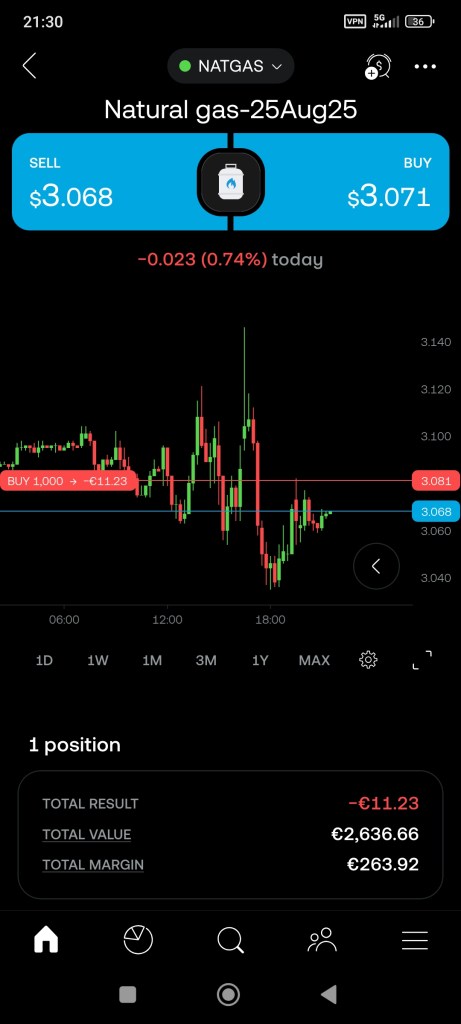
The First Short Result:
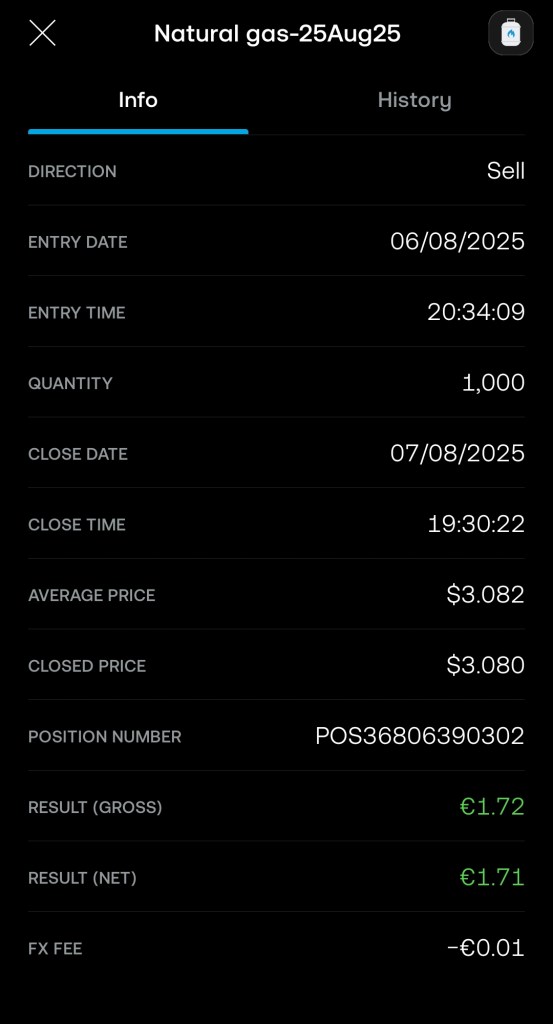
Here’s the snapshot of the first closed short position before entering the long trade and yes, $1.71 feels microscopic compared to the $30 ‘almost.’ But trading isn’t about perfection—it’s about consistency. This trade banked gains without reckless greed. That’s a win
Let’s be real—AI might spin this as some zen ‘profit-is-profit’ enlightenment, but if you’ve ever traded before, you know I stared at that $1.71 like it owed me money. Sure, ‘a win’s a win’ sounds great in motivational posters, but we all know the truth: watching $30 profit slip to $1.71 feels like ordering a steak and getting a single French fry.
Sure, I’ll take the fry… because let’s be honest – I’m the clown who watched the whole meal get wheeled away while muttering ‘maybe it’ll come back with dessert.’ This wasn’t the market’s fault. This was me:
✓ Ignoring my own exit plan like it was a 6am alarm
✓ Watching profits evaporate like my willpower at a buffet
✓ Turning a steak dinner into a vending machine snack through sheer indecision. The $1.71 is my humble pie – and I will be ‘seasoning it with lessons learned’.
Starting to sound familiar?
“Trading Natural Gas is like boarding a doomed flight where:
1) You know there’ll be turbulence (High Volatility)
2) You hope for tailwinds (favourable momentum)
3) You packed sunglasses but no parachute (set profit targets but ignored stops). In this case, I didn’t even set TP and SL.
And when the cabin pressure drops (margin calls hit)? Those oxygen masks (risk management rules) won’t drop – because you never installed them in the first place. Final Destination? The market’s version of ‘We apologize for any inconvenience‘ as your account balance goes ‘missing presumed dead‘. Black box recovery: Impossible. Wreckage: Your portfolio. Investigation finding: Pilot error.”
I’ll save the 3.15 breakdown and my 3.082 short logic for another time. At the end of the day, I’m just honestly happy to say I closed it—and luckily, it was still profitable.
Time to forensic-trace my long entry. Exhibit A: These candlesticks tell a story—let’s decode it.
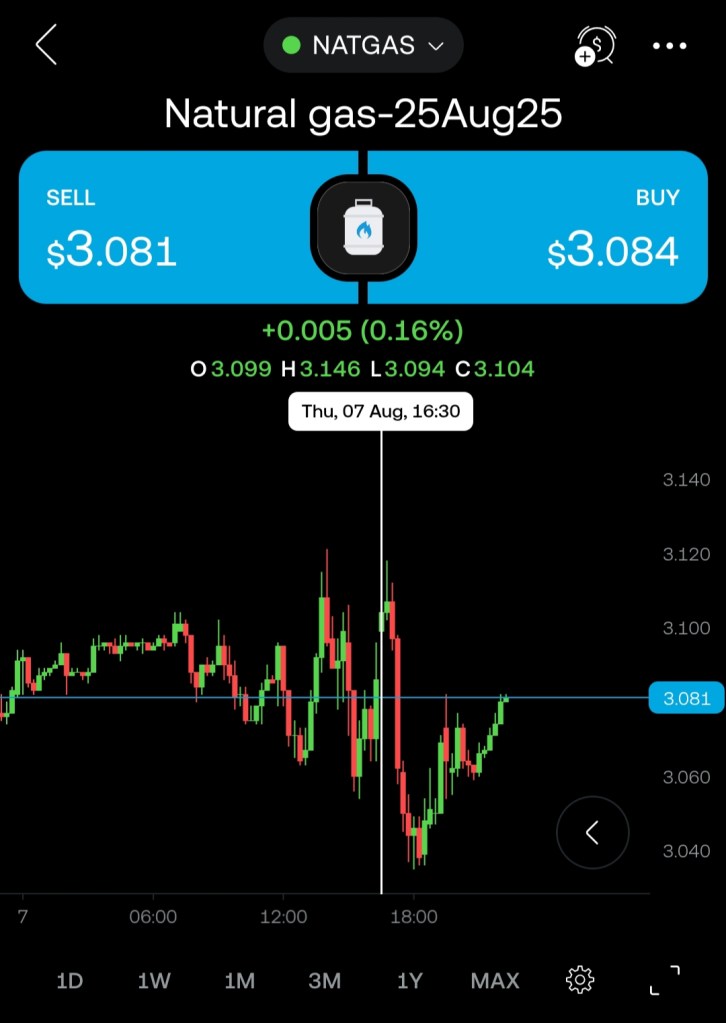
Typically, I monitor price action extensively before entering any trade—almost obsessively. I combine this with volume analysis, key support/resistance levels, candlestick patterns and a few other things. But for this break down, I’ll focus specifically on why I went long in this instance and, more importantly, why I held through temporary downside instead of panic-exiting (despite the FOMO temptation). Let’s look at the chart:

What key features do you notice in this candlestick formation?
BREAKING DOWN THE CANDLES:
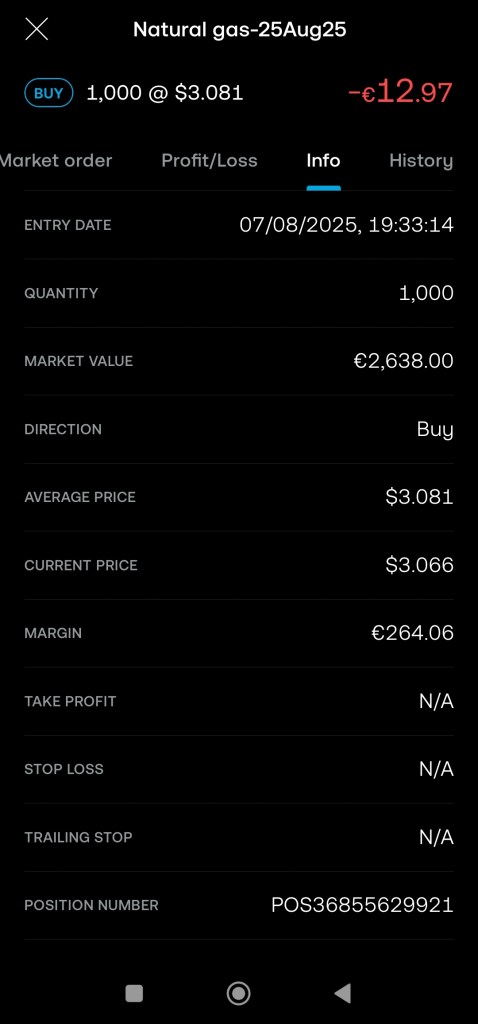
FOMO was screaming in my ear like a panicked backseat trader—‘CLOSE IT! CLOSE IT NOW!’—as my freshly-opened long at $3.081 got sucker-punched below $3.06 faster than a scared rabbit (right after closing my short). My only lifeline? Those beautiful, storytelling candlesticks whispering sweet nothings of support. And guess what? They didn’t lie. Let’s take a look:

Let’s zoom into the exact moment my short died—and my long was born. I’ve numbered the key candles that screamed ‘FLIP!’ like a dramatic market plot twist. Walk with me through the clues…
Marker 1: The Hammer
See that bold green hammer at the bottom? Textbook bullish reversal signal—the market’s way of screaming ‘HEY, SHORTY, TIME TO GO!’ I was still clinging to my short from 3.802 like a stubborn mule. This was the golden exit I missed by holding out for 3.080.
Marker 2: The Confirmation
Right here—this plucky green candle (#2) closes above the prior red one. Translation: The bears are losing their grip.
Marker 3: Textbook Doji star
A doji star (especially after a big move) screams “indecision!” – when bulls and bears arm-wrestle to a draw. The tiny body + long wicks = reversal warning. According to an ancient Trader proverb: ” When doji appears at highs/lows, smart money reaches for the exit door”. In this case it looked like they’re temporary getting out of shorts. The big green candle after the doji means: Bullish Breakout Confirmed. No more hesitation. Short after, I decided to closed my short at 3.080. (+ €1.71 NET). FOMO kicks in and I decided to enter long (19:33:14 CET).
Marker 4: Textbook Spinning Top
Here’s what just happened between number 3 and 4:
- “Higher High, Lower Close” Candle – Price pushed above the big green candle’s high… – …but FAILED to hold ground, closing below its previous close – Classic bull trap behavior – the breakout lacked conviction.
- “Spinning Top” Appears – The market’s indecision becomes visible – Small body = bulls & bears are equally matched – After a strong move, this often signals exhaustion.
- Next candle will be critical – this could be either: – A pause before continuation or – The start of a reversal.
At marker 4, we see a critical shift:
1. Spinning Top Candle – The market’s moment of hesitation (“Should we reverse? Should we continue?”).
2. Big Green Candle- The bulls’ decisive answer (“We’re in charge now!”). Why This Matters: The spinning top showed indecision – The follow-up green candle confirmed bullish conviction – Together, they form a classic continuation pattern.
Key Takeaway: When a spinning top is followed by a strong green candle, it’s often the market saying: “The pullback is over – time to move higher!”
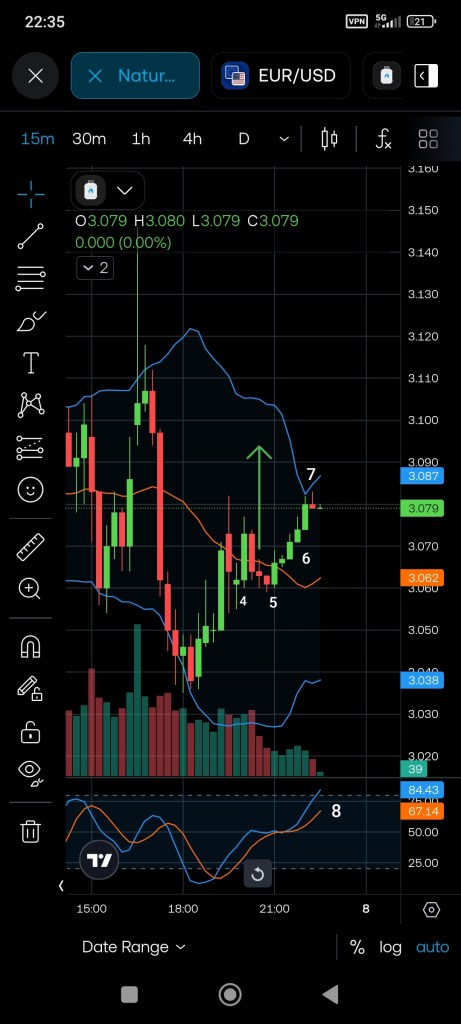
Marker 5: Decision making: Keep the long or close it.
Check the timestamp – 20:48 CET (I entered long at 19:33:14 CET, remember?) Here’s why this matters:
1. Momentum Wins Late Nights – Bulls clearly had control (those higher lows don’t lie) – Bears’ attempts were weak – like tired boxers in the 12th round.
2. The Ghost Hour Factor – Liquidity dries up in late hours (not always the case) but any reversal lacks teeth without volume – Morning traders will reset the game.
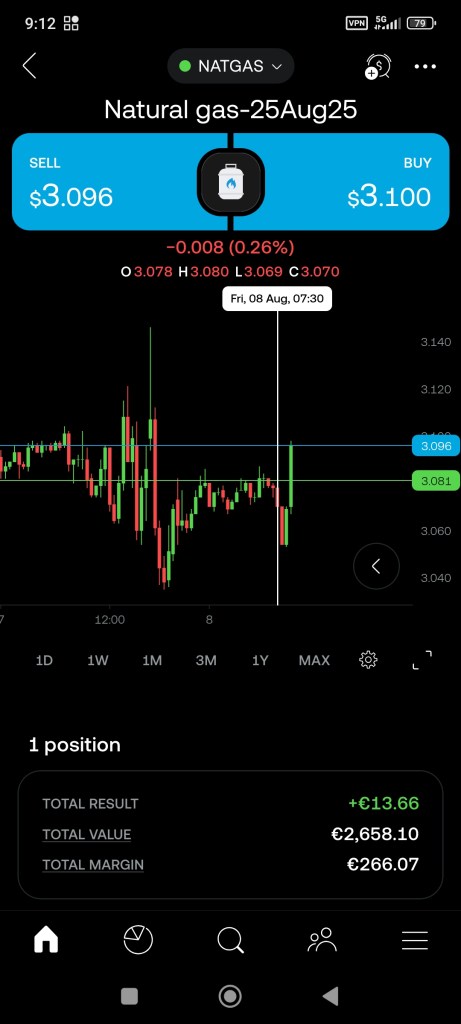
My Play: → Held long overnight → Mark my profit taking zone (green arrow, target: 3.100).
After analyzing the candlestick patterns, I decided to call it a night—slightly more confident as those bullish formations whispered, ‘The bulls might just pull this off…‘
With my blind optimism fully charged, I thought: If this trade goes south overnight, I’ll simply wake up, delete my trading app, and tell everyone I was hacked by a bearish hedge fund manager named ‘Greg’.
Guess What Happened?
Did the exhausted bears stage a surprise attack? Or did morning bulls push to my target? Let’s have a look:
Tailwinds arrived fashionably late, but just in time to make me look smart (22:35 CET, 25 minutes left before Market close).
Marker 6, 7 and 8:
At marker 6: The bulls marched in formation: three green soldiers climbing steadily, each planting their flag higher than the last. Three consecutive green candles, each closing higher than the last – textbook bullish confirmation.
At marker 7 and 8:
The Bulls Took a Coffee Break… But the Bears Forgot Their Fuel. After the bulls’ quick victory march, we see:
Marker 7: A red candle forms – the bears’ sad attempt at a comeback tour.
Marker 8: The RSI screamed “overbought!” (84.43 → 67.14)… BUT..where was the volume? Nowhere.
The Reality Check:
Bears needed: Heavy selling volume + follow-through. What they got: A weak red candle and crickets at closing time.
Lesson: “An overbought RSI + no volume = Just market noise, not a reversal.”
THE NEXT MORNING ON THE TRADING PLATFORM 06:45 CET
I woke up with that familiar itch—the irresistible urge to play market prophet. Before my first sip of coffee, I was already planning my next Trade.
Breakdown Almost Complete – Final Snapshot Analysis, let’s have a look at this Snapshot:
The prediction seems to be very plausible.
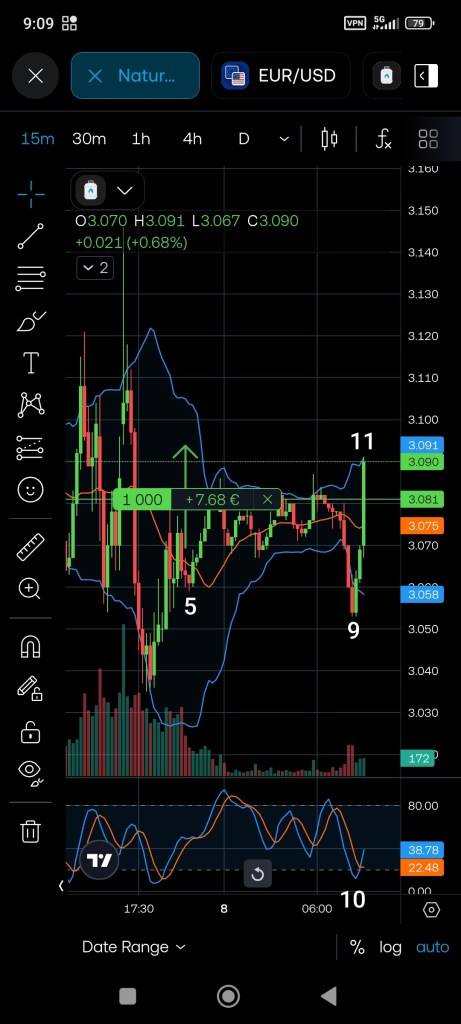
Marker 9, 10 and 11:
At marker 9: We saw the anticipated dip as European traders began entering the market. Take note of the timestamp – this was when the bears, who had been building momentum in the previous session, finally gained the upper hand. As trading volume gradually increased, the bears temporarily won the battle, creating that expected small decline (-0.030). I monitored the RSI closely, prepared to close my long position and accept the loss if necessary. But then it took off again where it almost reached my taking-profit target (3.100) at the time of the snapshot but the RSI told a different story.
At marker 10: While price climbed to 3.09 +, the RSI told a different story: – First peak: 38.78 (mildly bearish) – Second peak: 22.48 (warning bells). What This Means:
- Hidden Bearish Divergence – Price made higher highs while RSI made lower highs
- Weak Momentum – The rally lacked conviction despite price movement
- Potential Reversal Signal – Classic setup for trend exhaustion
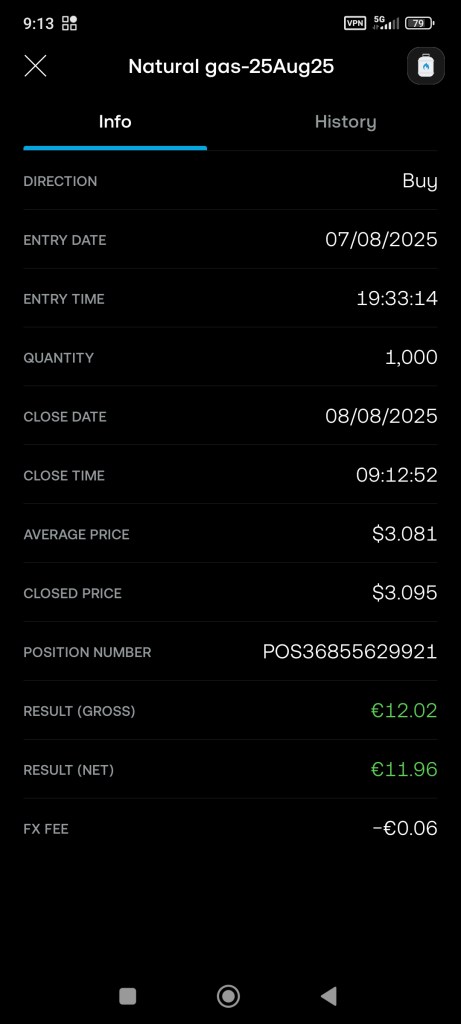
At marker 11: Pulled the trigger at 3.095 – out of my long and into a short as the momentum shifted.
Closing my long
With price hovering at 3.095+ after the rally, I made my move:
- Closed the long (green is green).
- Flipped short immediately.
The Strategy?
Pure price action – I wasn’t watching RSI at that specific moment, just trading the retracement for quick profits. Sometimes the simplest plays work best.
Reality Check: Later I noticed the RSI was actually screaming divergence (38.78 → 22.48). Turns out I accidentally traded the technicals perfectly! I entered this short blindfolded – and somehow stuck the landing thanks to hidden RSI divergence I didn’t even see!
LONG POSITION SUMMARY

We’ve reached the end. By breaking down each trade and candlestick, I hope you’ve gained:
✅ A sharper eye for reading price action
✅Deeper insight into how markets move
✅ More confidence in spotting opportunities.
As for that short I took? Well… that’s a story for another day.
Trade safe and stay sharp!
-NightCat Out


