This week’s intelligence breakdown: price gaps
Disclaimer: This is not financial advise. Always do your own research and consult a professional before making any financial decisions.
Data sources from: Trading 212 | Investing.com | TradingView | Prices in USD | AI Tool
WEEK 33: AUG 11-15 ERT 10 MIN
Mission Objective
As part of our 4-week daytrading campaign, we’re starting fresh with €300 each week. The goal remains the same: secure a weekly profit of €50 — a 16.7% gain per operation.
Week 33 Overview
Using €300 as our capital, we engaged in six trades amidst intense market volatility and whipsaw price action. The result? A tactical victory (+53.96% total gain, biggest profitable trade +€120.07) secured through sheer discipline.
The battlefield report shows only two trades returned as clear wins. However, their gains were significant enough to overwhelm the two losing positions (biggest lost -€20.61), proving the power of strategic profit-taking. Two additional operations were scrubbed at breakeven (€0), a successful evac under volatile conditions.
The challenge is a definitive success so far, demonstrating remarkable consistency and profitability. Let’s see if we can maintain this incredible momentum in week 34!
This week’s intelligence breakdown: price gaps
This week’s intelligence breakdown: we’re analyzing price gaps —those rapid jumps between the closing price and the next open—where quick opportunities are identified and trades are executed.
price gap
Introduction: What is a Gap?
In the world of technical analysis, a “gap” is a clear discontinuity on a price chart. It occurs when the closing price of one trading session is significantly different from the opening price of the next, with no trading activity in between. This creates a literal “gap” on the candlestick or bar chart.Gaps are powerful indicators of shifting market sentiment. They are often caused by new information—like economic data, weather forecasts, earnings reports, or geopolitical events—that emerges while the market is closed, causing a surge of buy or sell orders at the next open. There are several types of gaps (Common, Breakaway, Runaway, and Exhaustion), but today we’re dissecting a classic example from the Natural Gas (NG) futures market to see the theory in action.Let’s break down a specific gap down and its subsequent price action from week 32 into 33.
The Natural Gas Gap Down: Week 32 to Week 33
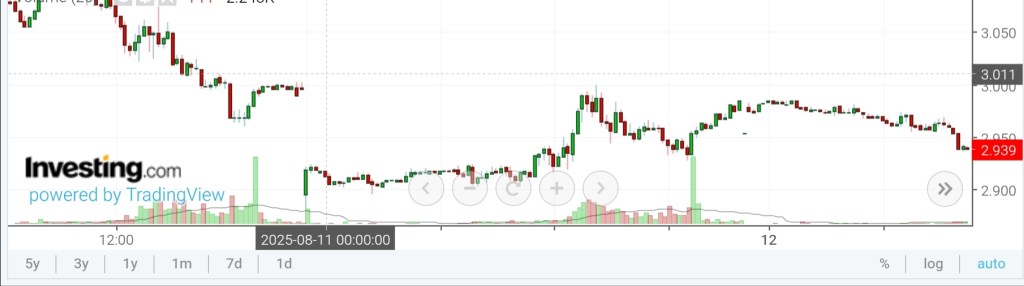
The following table summarizes the key price levels and times for the move we’ll be analyzing.
| Description | Date | Time CET | Time ET | Price | Volume |
| Previous Close | Aug 8 | Market Close | Market Close | 2.990 | n/a |
| Next Week Open | Aug 11 | 00:00 | Aug 10, 06:00 PM | 2.895 | ~4.2k |
| Gap Size | 0.095 | ||||
| Session High (gap fill) | Aug 11 | 15:00 | 09:00 AM | 2.998 | ~17.8k |
| Session Low | Aug 11 | 20:00 | 14:00 PM | 2.926 | ~24.8k |
| Session Close | Aug 11 | Market Close | Market Close | 2.983 | ~500-2k |
What Happened?
1. The Gap Down (2.990 -> 2.895): The market closed Friday at 2.990 and opened the new week Sunday evening with a steep decline to 2.895. This 0.095 gap down was almost certainly driven by a shift in fundamental data over the weekend. The most likely culprit? A bearish change in weather forecasts, predicting milder temperatures and lower demand for gas-fired power generation, or traders reacting to a storage report.
2. The Gap Fill Rally (2.895 -> 2.998): After the initial panic selling, the price began a steady climb. This is a common phenomenon known as a “gap fill“. Algorithmic traders and contrarians often see a large gap as an overreaction and step in to buy, pushing the price back toward the point of the gap. By 15:00 CET (9:00 AM ET), the price had not only filled the gap but had slightly exceeded Friday’s close, hitting a high of 2.998.
3. The Rejection and Close (2.998 -> 2.983): However, the rally lacked conviction. The underlying fundamental reason for the gap down (lower demand) was still valid. The fill was driven by short-term traders, not a change in the core narrative. As buying momentum waned, sellers re-emerged, pushing the price down to a low of 2.926 before it settled to close at 2.983. This created a classic “rejection” candle at the top of the range, signaling that the bears were still in control.
Key Takeaway:
This price action is a textbook example of how markets often mechanically fill gaps created by emotional overnight moves. However, the failure to hold those gains and close strong revealed the market’s true, bearish sentiment for the session. For traders, this pattern signals that the path of least resistance remains lower, and the filled gap now acts as a new resistance zone.
The Volume Tells the Real Story
In our previous breakdown, we analyzed the price action of the Natural Gas gap down. But price is only half the story. Volume is the fuel behind every move. The volume data paints a much more dynamic and interesting picture of the battle between bulls and bears that day.Let’s integrate this critical data into our analysis.
Re-Analyzing the Move with Volume
The volume data forces us to reinterpret the initial rally. This wasn’t a weak, mechanical bounce; it was a strong, high-conviction counter-attack by the bulls.
1. The Opening (00:00 CET): Volume ~4.2k The relatively modest volume on the gap down open is interesting. It suggests the initial sell-off wasn’t an all-out panic, but more of a consensus move based on the weekend’s bearish news. The market simply opened lower where everyone agreed it should.
2. The Rally to Fill the Gap (00:00 – 15:00 CET): Volume Climbs to ~17k This is the most critical insight. The volume didn’t decline on the way up—it increased significantly. This tells us the buying pressure was real and assertive. This wasn’t just algorithms fading a gap; this was a wave of traders believing the gap was a massive overreaction and aggressively buying, convinced the market was wrong. The high volume on the push to 2.998 confirms strong bullish conviction, at least in the short term.
3. The Sell-off to the Higher Low (15:00 – 20:00 CET): Volume Peaks at ~24.8k The volume story gets even more fascinating here. The sell-off from the daily high wasn’t on low volume; it occurred on the highest volume of the day (~24.8k). This indicates that the Bears mounted an equally powerful, high-conviction counter-attack right at the moment the Bulls had successfully filled the gap.This created a classic “volume battle”: massive buying met with even more massive selling. The fact that price declined from its high on this peak volume is a strong sign that the selling pressure won the battle at that moment.
4. The Drift into the Close (20:00 – Close): Volume Dries to ~0.5k-2k After the epic volume battle around the US market open (9:00 AM – 2:00 PM ET), energy left the market. The low volume into the close suggests a period of consolidation and indecision. The price drifted slightly upward from the low, but the ultra-low volume means this minor bounce carries little significance.
The Revised Narrative: A Battle Royale
With volume, the story changes from a simple “gap and fill” to a fierce battle between Bulls and Bears with no clear winner by the close.
- The Opening Bell: Bears score an early points with the gap down.
- The Bullish Counter-Punch: Bulls roar back with high-volume buying, believing the market oversold. They successfully win the first round by filling the gap.
- The Bear’s Defense: Just as the Bulls declare victory, the Bears unleash their strongest force (peak volume), defending the 2.998 level fiercely and knocking the price down significantly.
- The Stalemate: After the high-volume clash, both sides are exhausted. The market closes in a tense stalemate, with price settling almost midway between the day’s high and low.
Key Takeaway with Volume
The high volume on both the rally and the decline reveals a market in conflict, not in consensus. The Bears initially controlled the narrative, but the Bulls put up a very strong fight. This kind of action often leads to increased volatility in the following sessions as the market searches for its next true direction.
For a trader, this means the ~2.998 level is now a major resistance zone (rejected on high volume), and the ~2.926 level is key support (where buyers stepped in on the highest volume). A break above or below either of these levels on significant volume would likely dictate the next major move.
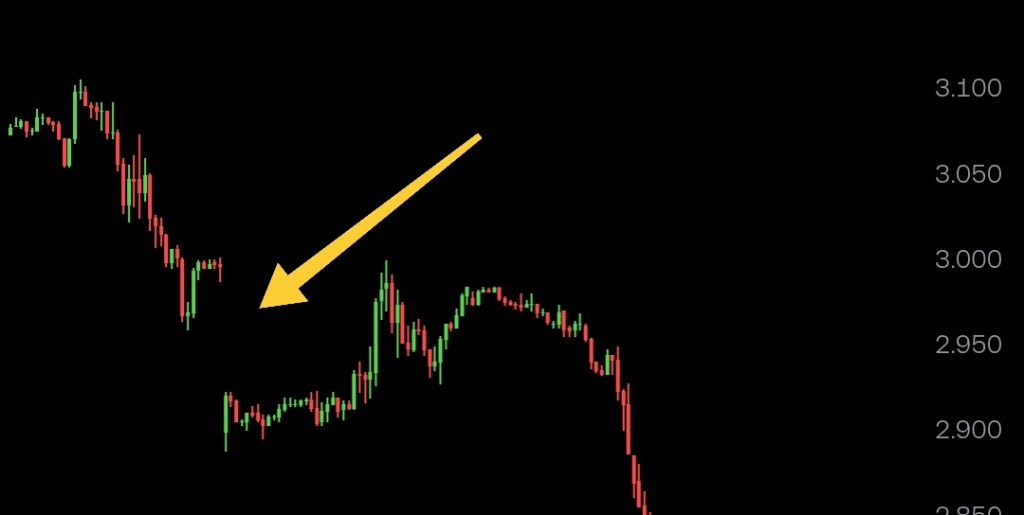
The Resolution – Support Breaks and the Waterfall Decline
Our analysis so far revealed a tense stalemate by the close on August 11th. The market had witnessed a fierce high-volume battle, leaving key levels in place. The question for the next session was simple: who would win the war?
The chart below shows the key support and resistance levels established on August 11th and the subsequent break.

Who’s in Control X Session’s Volume
As the chart illustrates, the intense, high-volume selling pressure at the key support level on August 11th was a clear warning sign. This breakdown tells us the high-volume battle, while initially seeming like a stalemate, actually revealed underlying weakness. The Bears weren’t just defending resistance; they were accumulating force for a true breakdown.
The Narrative Concludes: Bears Win the War
The Break of Support (Aug 12): The key ~2.926 support level —which was established on the highest volume of the previous day—was breached on August 12th. This was not a gentle break. Given the volume data from the day before, it was almost certainly a high-volume break.
This is a critical technical event. A level that was defended so fiercely by buyers (hence the high volume at the ~2.926 low on Aug 11) should act as strong support. When it breaks, it signals that all the buyers who stepped in there have now been overwhelmed by a new, stronger wave of selling pressure. Their positions are under water, and many are likely being forced to sell (liquidate), adding more fuel to the downward move.
The Waterfall Decline: Once this key support level gave way, the result was a waterfall decline (Aug 12). This type of move is characterized by a rapid, near-vertical price drop on sustained high volume. It’s often driven by a combination of:
- New Bears entering short positions on the break of support.
- Long liquidation from bulls who bought the dip the previous day now being forced to sell to cap their losses.
- Algorithmic selling accelerating as key technical levels are broken.
The Bears’ victory was complete. The high-volume rally on August 11th was not a sign of strength but a “bull trap.” It sucked in optimistic buyers right before the underlying bearish fundamentals reasserted their control with devastating force.
Week 33’s Lessons: Volume is the Ultimate Truth-Teller
This two-day sequence is a masterclass in market dynamics:
- Price Shows You Levels: The daily high and low established clear zones of resistance and support.
- Volume Shows You Conviction: The high volume during the battle on the 11th signaled a major conflict was underway, not a mere technical correction.
- Break of High-Volume Nodes Reveals the Winner: The ultimate break of the high-volume support level at ~2.926 was the definitive signal that the Bears had won the battle. It was the confirmation to expect continued downward momentum.
The lesson is clear: Always wait for the resolution. The glamorous gap-fill rally was tempting, but the true, high-conviction move began only after the market showed its hand by breaking the key level it had fought so hard to defend. This is why traders so often say, “Volume is the weapon that moves price.” In this case, the Bears brought a bigger gun to the fight.


